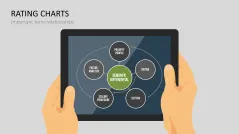
Use Professionally Designed Charts to Rate, Compare, Evaluate and Create Polarity Profiles.
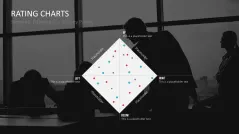
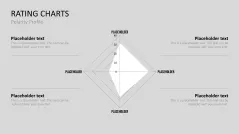
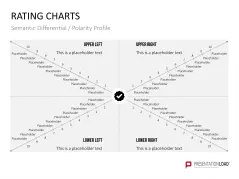
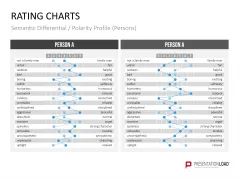
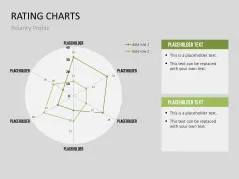
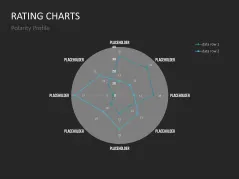
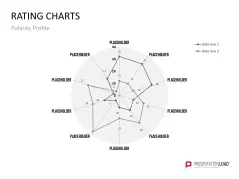
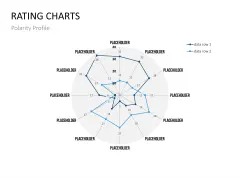
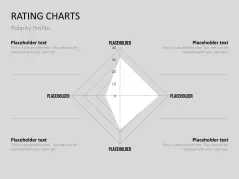
Semantic Differential
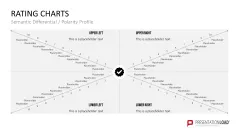
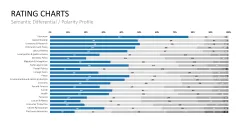
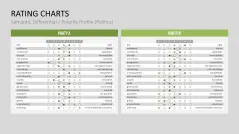
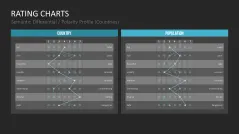
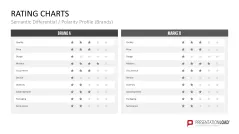
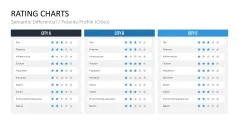
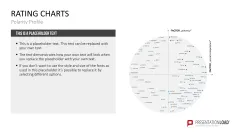
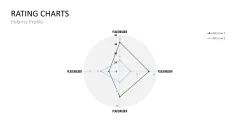
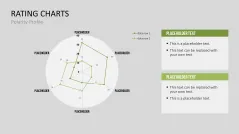
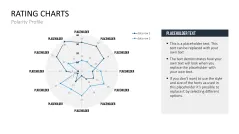
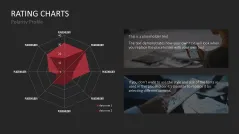
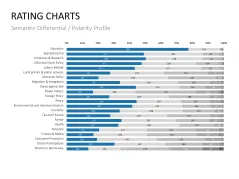
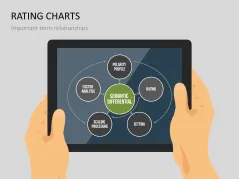
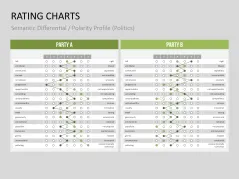
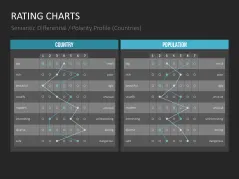
Semantic Differential is a type of rating scale used to measure attitudes or feelings towards objects or concepts using seven-tier scales with polar pairs of adjectives.A polarity profile is obtained, by combining the results from the individual scales. This provides information about how the chosen object is perceived. This profile can then be evaluated using various methods and analyses.
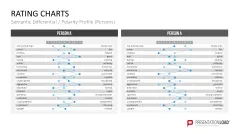
Present Evaluation Methods and Results
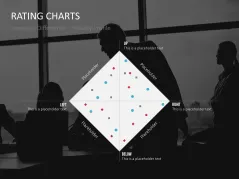
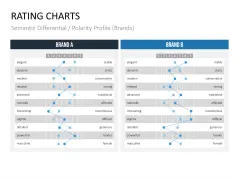
Companies mostly use rating scales for market research purposes to assess brands, locations, people, products, and services. The results and their evaluation are clearly communicated to third parties using professional rating scales and polarity profile graphics.Comprehensive Rating Scales Set
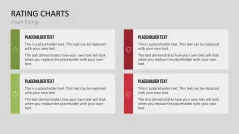
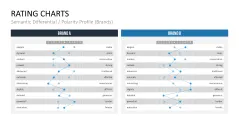
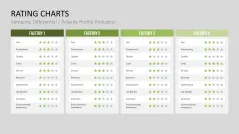
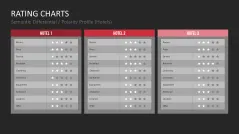
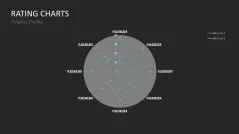
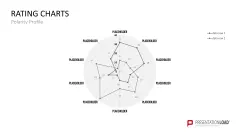
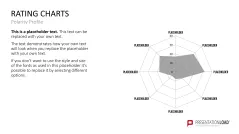
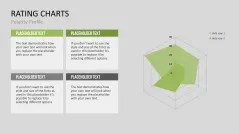
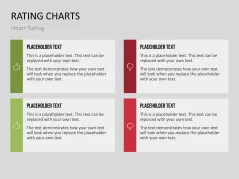
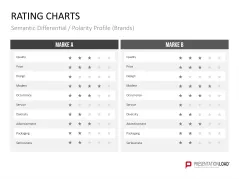
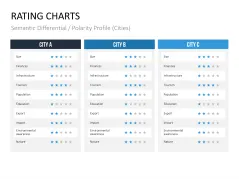
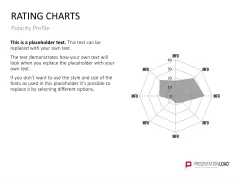
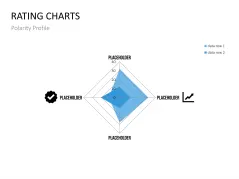
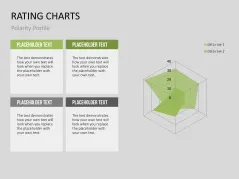
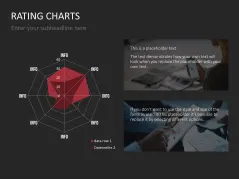
The Rating Charts toolbox includes a variety of rating scale charts to evaluate brands, locations, people, products, and services, and includes several forms of polarity profiles to display results.Present ratings quickly and clearly: fill the text placeholders with your own criteria, determine the properties to be compared and display the results in data-driven polarity profiles.
With Our Rating Charts PowerPoint Slides You Can
- rate various objects with professional scaling methods
- compile rating scales according to your own criteria
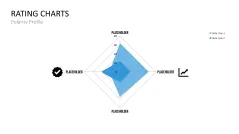
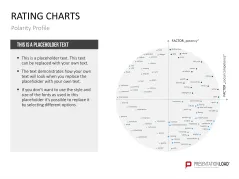
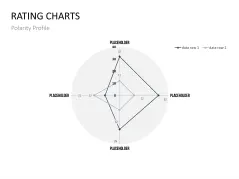
- display your results clearly using professionally designed polarity profile graphics
This PowerPoint Template Contains
- a wide selection of rating scales and polarity profile graphics
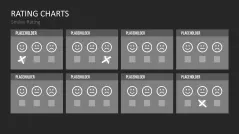
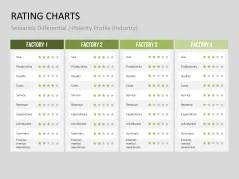
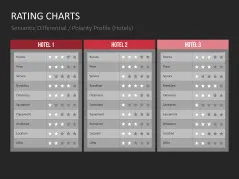
- theme-based rating scales (gastronomy, cities, industry, etc.)
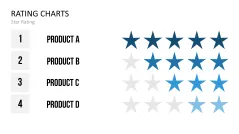
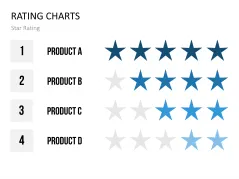
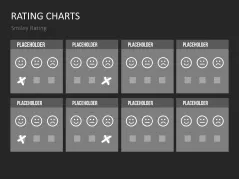
- star rating
- slides combining two or three polarity profile graphs
- data-driven slides that adapt to the input of your table values
- text placeholders for your own criteria and descriptions


Recommended for you
Customer also bought: