Excel in PowerPoint- Part 1
Presenting and discussing data tables during a presentation is par for the course, both for the speaker and attendees alike. In this two-part series, you will learn that tables are relatively simple to design when you consider the following topics:
1) Creating Tables in PowerPoint
1.1) Creating a Table on a Slide
1.2) Transferring Cells from Excel
1.3) Creating a Table from Slide Layout
1.4) Importing a Table from Word
1.5) Working in Excel and Updating a Table in PowerPoint Simultaneously
Be sure to check back soon for the second part of this article on our blog page.
1) Creating Tables in PowerPoint
In principle, you have four options:
Create a table on a slide
Transfer cells from Excel
Create via a slide layout
Import a table from Word
We’ll walk you through these different procedures and show you how changes made in Excel are automatically updated in PowerPoint.
1.1) Creating a Table on a Slide
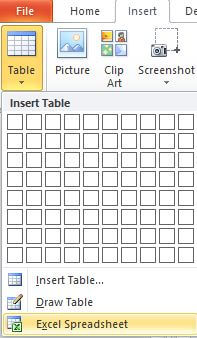
Depending on the size and length, you can quickly create a table using standard PowerPoint tools. Clicking on Insert > Table lets you choose the number of columns and rows your table should have.
You can always go back and adjust the number of columns and cells at any time.
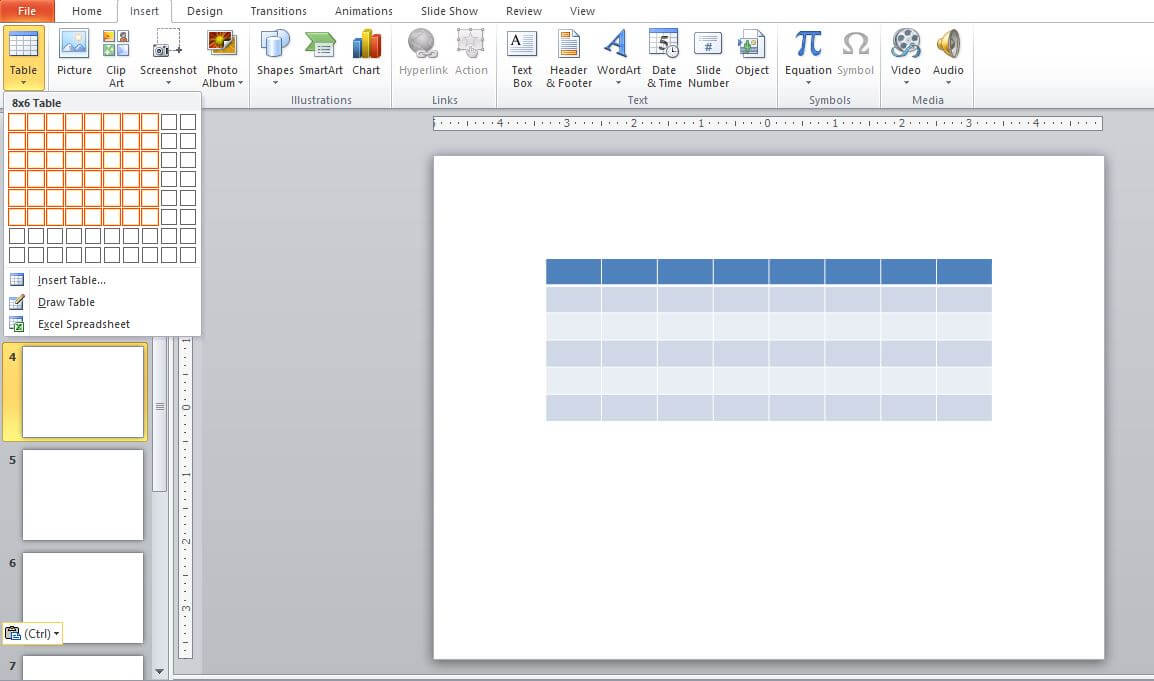
Just move the mouse pointer over the grid to highlight some of the cells. These highlighted cells correspond to the number of columns or rows (see next image). As soon as you click the selected cells, the table is displayed directly on the slide. By default, new tables are always set to “Medium Style 2 – Accent 1”.
Tip: While you are selecting the number of columns and rows, look directly at the slide. The table adjusts while you’re dragging the mouse over the grid. See the image below.
Tip: If you suddenly need an extra row, click on the last cell (lower right corner) and press Tab. An additional row will be added instantly. For more ways to adjust a table, go to Table Tools > Layout > Rows & Columns.
You can also enter numeric values directly:
A) Go to Insert> Table. The drop-down menu will appear.
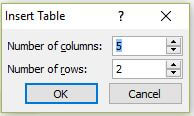
B) Below the grid, select Insert Table.
C) Enter the number of columns and rows in the pop-up window and click OK.
In special cases, e.g. scientific presentations, the table isn’t symmetrical with equally sized cells. Go to Insert > Table > Draw Table and design each cell individually.
After selecting this, the pointer changes to a pencil symbol. Design each cell by clicking and dragging to the desired size.
This approach requires a certain amount of experience and a bit of finesse. It’s usually easier to insert a standard table, build custom cells separately, and then join them together. Tip: Sketch a rough draft on a sheet of paper before putting it into PowerPoint.
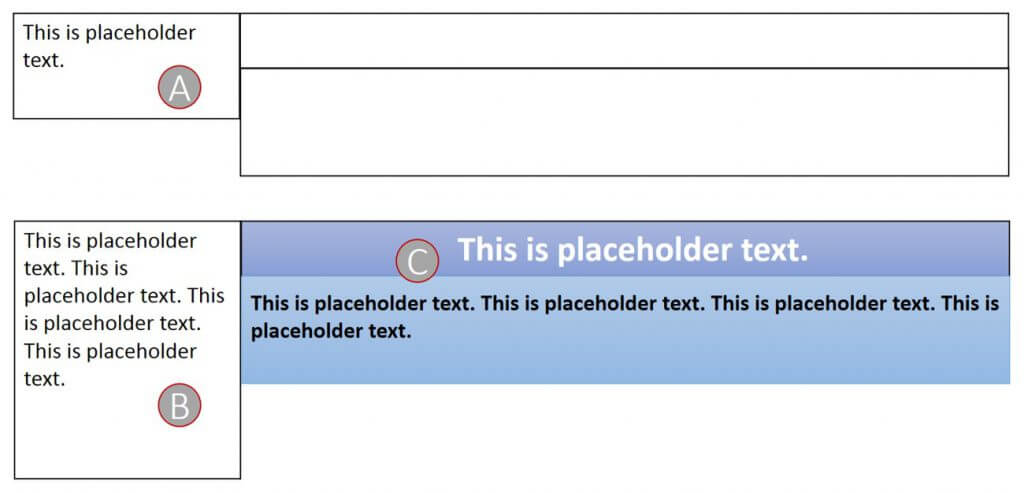
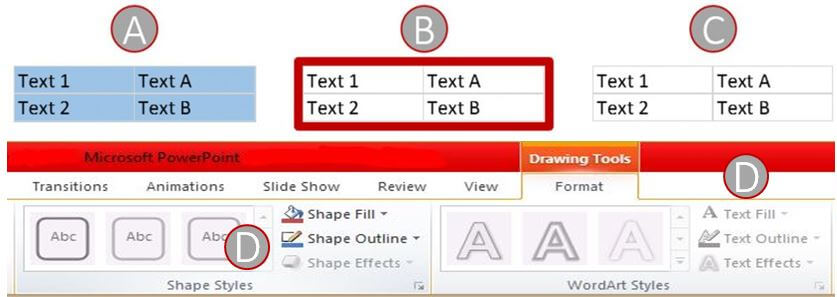
Take a look at the image below. Custom tables (on the left) function like normal tables (on the right) and can be designed in similar fashion.
A) Text can be entered into custom tables.B) Regardless of the size, your custom table will automatically adjust to fit any amount of text.
B) Regardless of the size, your custom table will automatically adjust to fit any amount of text.
C) You can change colors and text attributes in both table types.Tip: If you work regularly with custom tables, it might be useful to try out all options once to get well-acquainted with these settings.
Tip: With the exception of very individualized tables, it is usually a better idea to create custom tables from normal tables. This allows you to make changes and create tables more quickly than those created from scratch.
A) This graphic was created by the Draw Table option. Each cell has been drawn individually.
B) Normal tables were inserted here. This graphic took a lot less time to create and make slight alterations.
1.2) Transferring Cells from Excel
Most Office users are familiar with inserting Excel spreadsheets in PowerPoint. There are two ways of doing this.
The first way is by going to the drop-down menu under Insert > Table > Excel Spreadsheet. However, this command doesn’t insert an existing spreadsheet that’s saved on your computer.
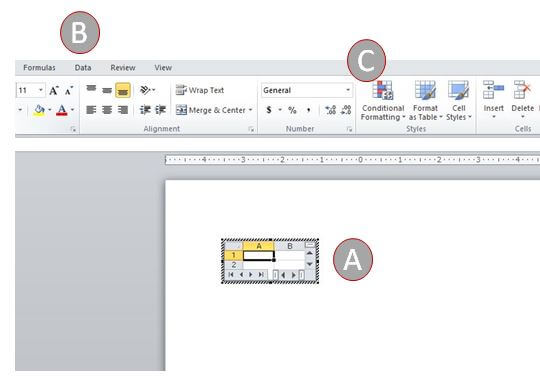
Selecting Excel Spreadsheet gives you the option to create a new table from scratch. This function will change the PowerPoint screen display.
A) A mini Excel table appears on the slide.
B) The Excel ribbon opens changing the display screen from PowerPoint to Excel.
C) As long as you work within this small table, the Excel ribbon will remain. If you click anywhere outside the table, the picture will change back to PowerPoint.
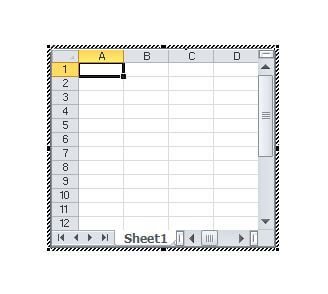
By default, the table is made up of two columns and two rows. Click along the striped border and drag to enlarge the table and create more columns and rows.
Just a reminder: As long as this table is selected, you are working in Excel, which is embedded directly in PowerPoint.
You can still insert text into any table cell just like in Excel. Pressing Enter, Right Arrow, or Left Arrow automatically takes you to the next cell.
Below are a few more tips for this dual activity in PowerPoint and Excel.
A) Texts have been added in this 2 x 2 table. To enlarge the size but keep the same number of cells, click outside the frame (exiting Excel mode). Then click and drag the border to the desired size.
B) Double-clicking on the table will reactivate Excel mode.
C) Once back in Excel mode, click and drag the striped frame to increase the number of cells.
A) This table is displayed in PowerPoint mode. Any design changes must be made in Excel mode, which can be reactivated any time in case of subsequent changes to the table.
B) Double-clicking on one of the cells in this table will reactivate Excel mode enabling you to add more content or make changes.
C) Click outside the table to see the modifications displayed in PowerPoint mode.
B) To change the color of the border, click Shape Outline and choose a color. However, this only changes the outer border and NOT the cell lines within.
C) Reason: If you just clicked on outer border, the tabs for Drawing Tools appear instead of Table Tools.
D) Therefore, most options will be in gray, and only a few options can be selected.
Copy cells directly from Excel.
Many users prefer to copy and paste an Excel table into PowerPoint.
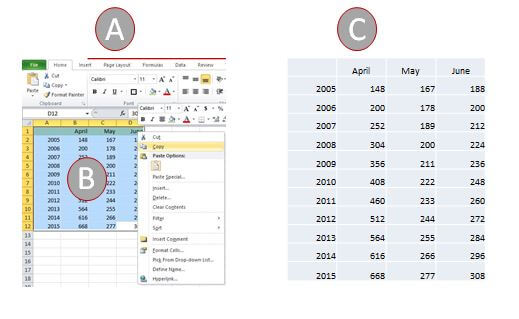
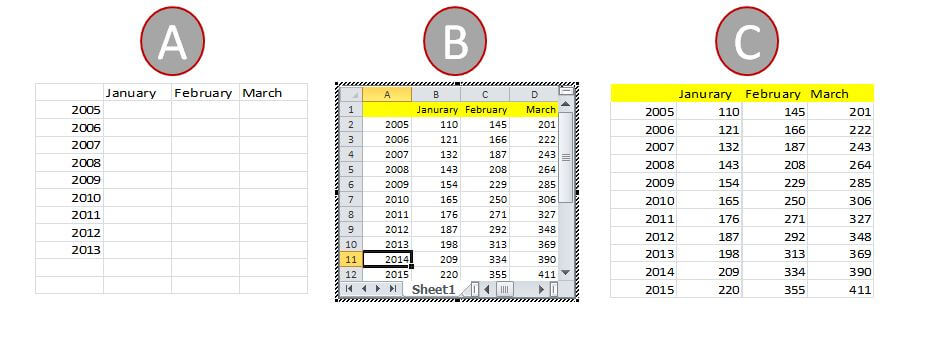
A) Select an Excel table that has already been created.
B) Highlight all cells. Right-click and select Copy.
C) The table looks like this after pressing Ctrl + V in PowerPoint.
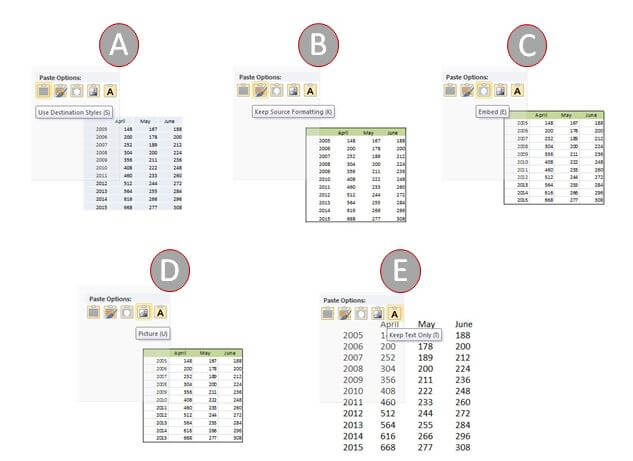
You have five different display options in PowerPoint.
A) Use Destination Styles pastes only the data from Excel to PowerPoint.
B) When you select Keep Source Formatting, all attributes such as colors, font, etc. are pasted from Excel to PowerPoint. However, if there are any graphics such as shapes, images, etc. inserted in the Excel table, they won’t carry over to PowerPoint in the same way. The graphic will be pasted as a picture object over the data in the upper left corner of the cell. This can be solved with the next option.
C) Selecting Embed will carry over all formatting and graphics to PowerPoint. Double-click the table to activate the Excel ribbon, as discussed earlier in this article. This is a real advantage for displaying and editing Excel tables in PowerPoint.
D) Picture pastes the Excel table as an image or graphic that can be edited with image processing tools – similar to a photo. However, individual texts cannot be changed.
E) With Keep Text Only, a text form of the table is created, which can be modified with Drawing Tools. Press Enter to insert a row, and jump from column to column with Tab.
PLEASE NOTE: Depending on how fast your computer is, how many applications are open, or how large the files are, switching back and forth from PowerPoint to Excel or Word can take a moment. Do not be surprised when the display looks strange when switching between programs.
1.3) Creating a Table from Slide Layout
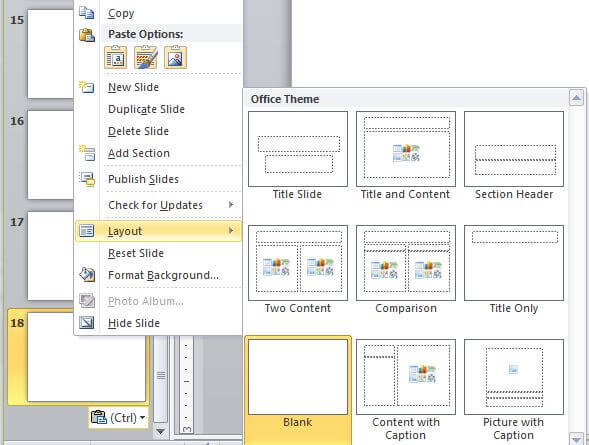
Select a slide on the overview to the left and right-click it to display the pop-up menu. Select Layout > Title and Content. The below image appears on the slide. Clicking on the icon in the upper-left corner will enable you to insert a table directly.
Click the table icon.
A pop-up window will appear, where you can manually input the number of columns and rows.
1.4) Importing a Table from Word
The procedure for copying and pasting tables from Word to PowerPoint is identical to that of Excel. From embedding it to importing it as a simple graphic, the same options apply. When you double-click the table, the Word ribbon is activated in PowerPoint.
IMPORTANT: Tables made in older versions of Word (.doc) are also opened in the older version. Tables from newer versions (.docx) can only be opened in PPT 2013.
1.5) Working in Excel and Updating a Table in PowerPoint Simultaneously
In some presentations, you need to work out and adjust certain numbers with your audience. While you’re making your modifications in Excel, these values should simultaneously be reflected in PowerPoint.
Embedding an Excel table only inserts the latest saved version but is not linked with Excel.
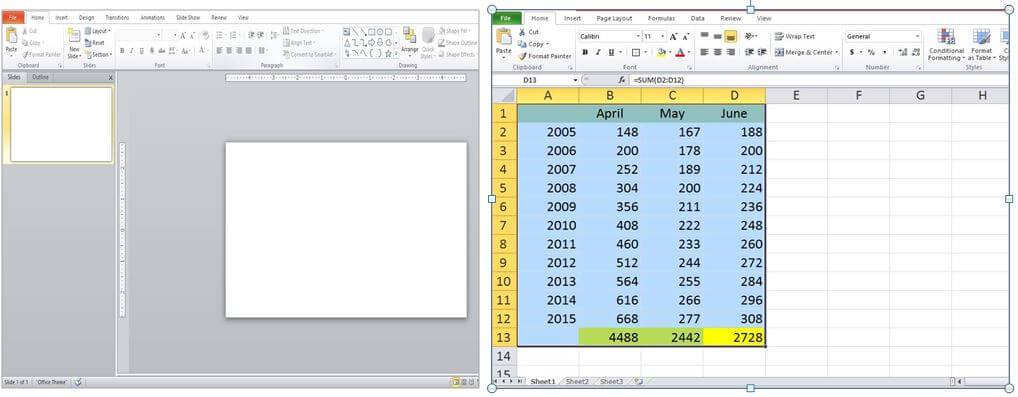
See the example below with PowerPoint and Excel.
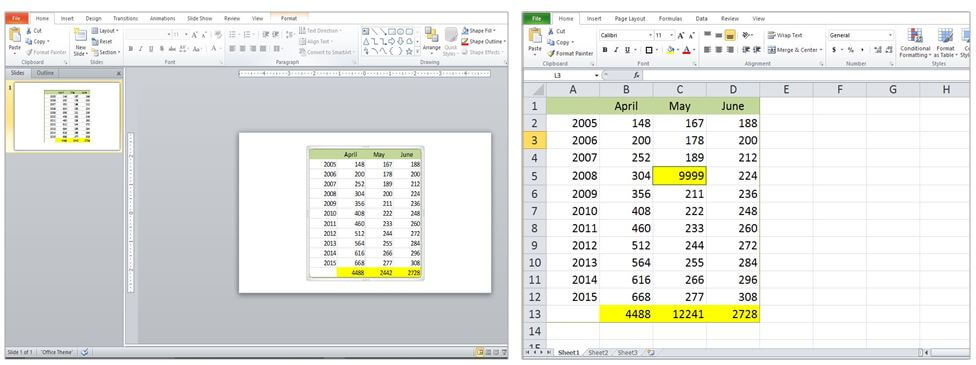
On the right is an Excel table that has been selected. On the left is a blank PowerPoint slide.
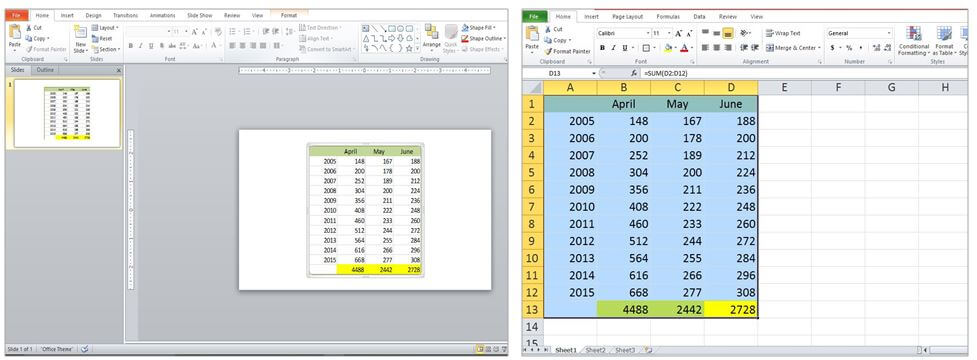
Now the table has been pasted in PowerPoint with the Embed function.
People make the mistake thinking that changing a value in the Excel table to the right will automatically update the table in PowerPoint. Unfortunately this is not the case.
On the right, the value in the highlighted cell (C5) has been changed to 9999. On the left, the value has not changed in PowerPoint.
Even when you click inside the embedded table in PowerPoint, the Excel ribbon will be activated, but no update will be performed.
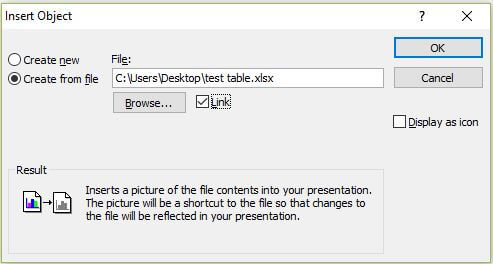
But not to worry, there is another way! Save your Excel table to your hard drive. In PowerPoint, select Insert and in the Text group select Object.
The Insert Object dialog box will appear. Select Create from file and click on Browse to open your file directory. Once you find your saved Excel table, click OK. Then, check the Link box next to Browse.
Now you will see the same table in both PowerPoint and Excel. The table in PPT is also linked to the one in Excel. When you make any changes to values or design in Excel, these are simultaneously displayed in PowerPoint after pressing ENTER, e.g. cell C8 (88888; fill, text color and size have been changed).
TIP: Are you familiar with “Presenter View” in PowerPoint? You can set it up so that the audience only sees the PowerPoint presentation while you work in Excel on your computer at the same time.
And just like the saying “all roads lead to Rome,” there is another, quicker way of linking an Excel table to PowerPoint.
1. Select all cells in Excel and right-click > Copy.
2. Switch to PowerPoint.
3. WAIT: Do NOT right-click and select any of the previous paste options!
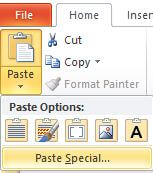
4. Instead, in the ribbon, select Home> Paste> Paste Special.
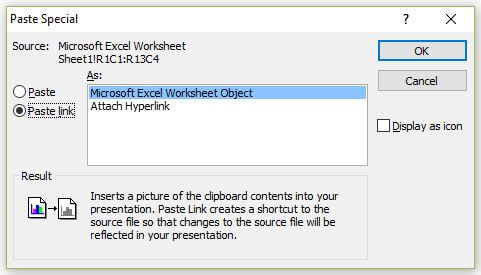
- Another window will appear. Click Paste Link and select (if not already) Microsoft Excel Worksheet Object.
- Now you can make changes in Excel, which will immediately update in PowerPoint.
Good luck! We hope you enjoyed reading this article.
