
Create Progress Bars in PowerPoint: How to do it quickly and easily – 2 Methods!
Progress bars are a valuable tool for visually representing the progress and status of projects or presentations. In PowerPoint, they offer an effective way to convey complex information at a glance and guide the audience’s attention.
But how do you create a compelling progress bar that is both informative and visually appealing? In this blog post, we will show you step by step how to create impressive progress bars in PowerPoint.
What is a progress bar?
A progress bar is a graphical representation that visualizes the progress or status of a specific process or task. Typically, a progress bar consists of a horizontal line or bar that fills or empties based on the progress.
The bar represents the overall progress, while the filled or empty area represents the completed or pending portion. Progress bars are useful tools for simplifying complex information and providing clear guidance to the audience.
Why you should include a progress bar in your next presentation
Progress bars in PowerPoint are commonly used in many presentations. They are an effective visual aid for illustrating the progress or status of a process, presentation, or project. They allow your audience to quickly understand how far the process has advanced and how much is left to be done.
In PowerPoint, progress bars can be used to provide clear orientation to the audience and enhance communication effectiveness. This facilitates understanding and improves the clarity of the presented information.
Additionally, progress bars help structure the flow of a presentation and provide the audience with a sense of the completed and pending parts. This promotes audience attention and engagement. Furthermore, progress bars add a professional and visually appealing touch to the presentation, enhancing the overall visual impact and impressing the audience.
How to Create a Progress Bar in PowerPoint
There are two options to display a progress bar in PowerPoint. You can either create a progress bar manually within PowerPoint or use code input to display a progress indicator on your slides. We’ll explain how both options work.
Option 1: Manually Create a Progress Bar in PowerPoint
Follow these quick and easy steps to create a progress bar directly in PowerPoint without any additional software:
Step 1: Insert a Rectangle Open your PowerPoint presentation
Go to the “Insert” tab and select the “Shapes” option. Here, you’ll find a variety of shapes, but the rectangle is the best choice for a classic progress bar. We recommend using a rectangle with rounded corners. The rectangle will serve as the foundation for your progress bar. Click on the rectangle tool and drag it to the desired size and position on the slide.
Step 2: Customize the Rectangle for the Progress Bar
To transform the rectangle into a progress bar, you need to customize it. Click on the rectangle to display the formatting options. Modify the colors of the bar by selecting a different fill color that matches your presentation design. Also, adjust the thickness of the bar to achieve the desired visual effect. Experiment with different colors and thicknesses to create the optimal progress bar for your presentation.
If you have chosen the option of a rounded rectangle, rotate it 90° counterclockwise or simply press the ALT + ← key combination six times.

Next, you can copy the shape multiple times as needed. You can use the commands Ctrl + C to copy and Ctrl + V to paste, and manually move the copies to the correct positions. The smart guides that PowerPoint displays will help you align them precisely.
Alternatively, you can use the time-saving shortcut Ctrl + D to duplicate the shape.
Rotate the last shape 180° to create an endpoint.

Then, select all the middle shapes and go to the “Drawing Tools/Format” tab, click on “Edit Shape“, then “Change Shape”, and choose Rectangle.
Finally, you can copy the progress bar to the appropriate slides and customize the colors as needed.

Step 3: Adding animations and effects
To animate the progress bar and represent the progress, you need to add animations. Select the progress bar and go to the “Animations” tab. Here, you will find a variety of animation effects.
A popular effect for progress bars is the “Wipe” effect, where the bar animates from left to right or vice versa. Choose your desired effect and adjust the duration and delay to customize the animation to your liking.
Step 4: Customizing the progress bar to fit the content
To adapt the progress bar to the content, you should adjust the length and position according to the information you want to convey. If the progress bar is meant to represent the progress of a specific process or task, you can change the length of the bar based on the percentage of completion.
Add text or numbers to indicate the progress more precisely. Customize the progress bar to be informative and easily understandable, supporting the content of your presentation effectively.
Option 2: Inserting a progress indicator using code
This option is for advanced PowerPoint users and requires some patience. If you don’t want to create a progress bar manually, you have the option to insert a progress indicator using code.
- Start your presentation in PowerPoint and go to the “View” tab.
- Click on “Macros” and enter a name for the macro. For simplicity, let’s name it “ProgressBar”.
- Click on “Create”.
- An editor will open. In the text box, you will see “Sub ProgressBar()” and “End Sub”.
- Between these two lines, enter the following code:
On Error Resume Next With ActivePresentation
For X = 1 To .Slides.Count
.Slides(X).Shapes(“PB”).Delete
Set s = .Slides(X).Shapes.AddShape(msoShapeRectangle, _
0, .PageSetup.SlideHeight – 8, _
X * .PageSetup.SlideWidth / .Slides.Count, 8)
s.Fill.ForeColor.RGB = RGB(150, 150, 40)
s.Name = “PB”
Next X:
End With - If you want to change the color of the progress bar, modify the RGB color code according to your preferences.
- To complete the process, select “File” and “Close and Return to Microsoft PowerPoint”.
To display the progress indicator in your presentation, you now need to go back to the “View” tab and click on “Macros” again. Select the created macro and click on “Run”.
To ensure that the changes are visible the next time you open the presentation, it’s important to save the PowerPoint file as .pptm, which stands for “PowerPoint with Macros”.
For a more detailed guide with images, you can refer to this link.
Making progress bars visually appealing
To make your progress bars stand out in presentations, here are some attractive ways to customize and visually enhance them:
- Using gradients and effects:
Instead of a solid color, you can create impressive progress bars in PowerPoint by incorporating gradients. Gradients add depth and dimension to your progress bars. Additionally, you can apply effects such as shadows or glows to make them even more eye-catching.
- Incorporating symbols and icons:
To make your progress bars more interesting, consider incorporating symbols and icons. Symbols can visually support the progress bars and emphasize the context or theme of your presentation. For example, use a checkmark symbol to indicate completed steps or a question mark symbol to draw attention to pending tasks.
PresentationLoad offers a wide range of professionally designed icons that you can explore in our shop.
- Using images or textures:
To enhance the background of your progress bars, you can use images or textures. Select an image or texture that aligns with the theme or mood of your presentation and place the progress bars on top of it.
Ensure that the image or texture is not too overpowering and does not obscure the progress bars. With a well-chosen background, you can seamlessly integrate the progress bars into your slides and achieve a visual wow factor.
- Adapting the progress indicator to different presentation themes:
Customize the visual appearance of your progress bars to align with your presentation content. For example, if you’re delivering a presentation about nature and the environment, consider creating a progress bar in the shape of a growing tree. For a technology-related presentation, you might use an animated loading bar as a progress indicator.
By tailoring the progress indicator to match the presentation theme, you enhance its impact and deliver your message more convincingly.
What to consider when incorporating progress bars
- Subtle design for a professional presentation:
Too many exaggerated animations or overly flashy effects can distract from the actual content and make the presentation appear unprofessional. A minimalist and understated approach that blends into the overall design of the slides is often the best choice to ensure a professional presentation.
In some cases, less is more. Simple and minimalist progress bars can be an elegant and professional way to represent progress. With clean lines and subtle colors, they integrate harmoniously into the overall design of the presentation without being distracting. A simple horizontal bar or a filling circle may be sufficient to visually illustrate progress.
Consider carefully whether you should opt for a simple or more elaborate (animated) progress bar.
- Align the progress bar with the content and the audience:
Before incorporating the progress bar, carefully consider how it aligns with the content and the audience. Think about the information you want to convey and how the progress bar can contribute to that.
Also, consider the expectations and prior knowledge of your audience. A clear and meaningful progress bar that is easy to understand will improve communication and engage the audience better.
Conclusion: Skillfully incorporate and use progress bars
Test one of the two methods described above to visualize project progress or presentation progress in your next presentation. You’ll see that it’s quicker than you might think!
If you have any questions about this article or PowerPoint in general, please don’t hesitate to contact us at [email protected]. We are here to help!
If you’re looking for visually supportive and professionally designed slide templates, feel free to explore our shop. We offer numerous pre-designed slides for various (business) topics that you can download. Visit our shop today! ► Shop
You might also be interested in these articles:
Share this post

-

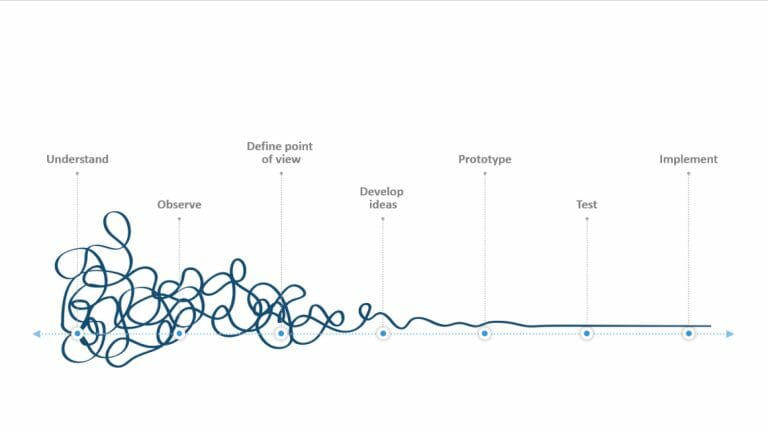
Design Thinking: Problem Solving with a Difference
-
Why Corporate Mission Statements Are So Important
-
7 Tips & Learnings from the Apple Keynote


-
Design Thinking: Problem Solving with a Difference
-
Why Corporate Mission Statements Are So Important
-
7 Tips & Learnings from the Apple Keynote