8 Tips for Better Bar Charts in PowerPoint!
Many presentations would be unthinkable without diagrams. With diagrams you visualize your data, numbers or facts better than with pure text blocks.
In addition, charts visually enhance your slides and have an appealing effect on your audience. Today we will show you how to prepare bar charts even better for your slides.
Bar chart: What is it?
Many people confuse bar charts with column charts. Column charts represent data by a bar in a vertical arrangement, while bar charts are nothing more than a rotated column chart: they represent data in a horizontal arrangement.
The great advantage of this chart is that long labels, such as questions in surveys, can be used due to the horizontal arrangement of the columns. This type of chart is ideal for displaying rankings.
When a bar chart is useful
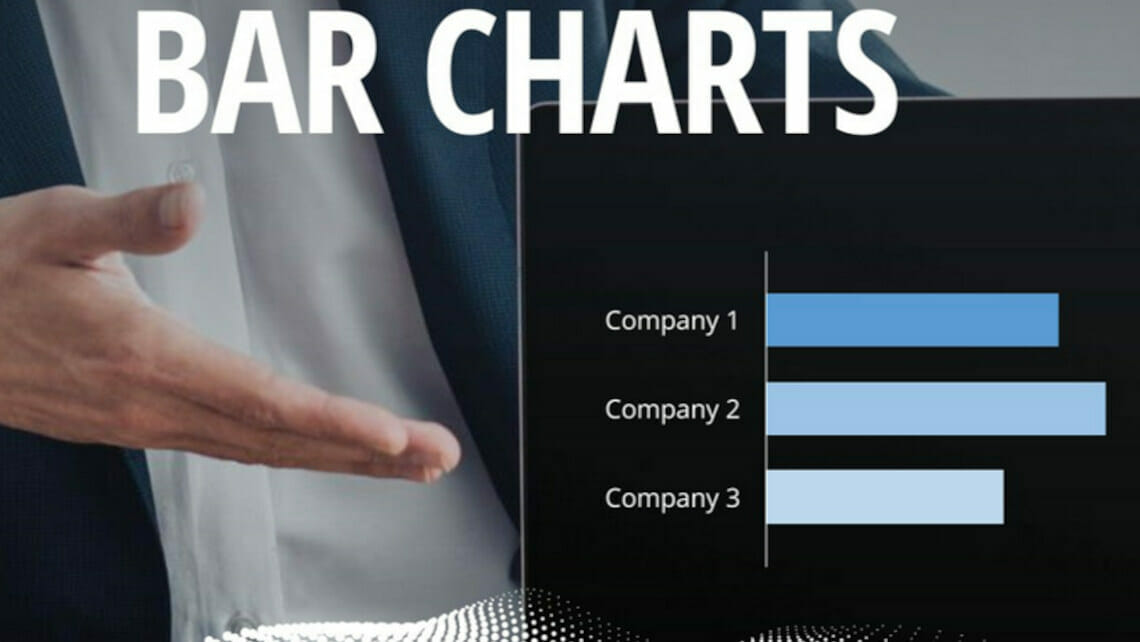
The horizontal bar chart is the best chart for showing comparisons between multiple data categories. This data visualization allows you to compare companies with each other, for example, the performance of different companies.
Using horizontal bar charts instead of vertical column charts also has these three advantages:
✔️ Long labels for categories are easier to read and display.
✔️ Many categories are easier to display.
✔️ Labels for many bars are easier to display without collisions..
Optimize bar charts: 8 tips for better bar charts
To make your bar chart stand out from your previous designs and stay in your audience’s mind, we’ve summarized some tips&tricks for you. Discover these 8 tips to make a bar chart more engaging and understandable:
- Sort your data horizontally
Horizontal bar charts are optimal for displaying data when you have many different categories with long, wordy labels.
They are easy to read and understand and can be used to compare data between different categories.

2. Sort your data in descending order
In general, it is recommended to sort the data so that the most interesting item or the item with the highest value is displayed first.

3. Use the correct beam widths
The distance between the beams should be half the width of the beams themselves.

4. Use colors wisely
You can use different colors to indicate different data sets. Alternatively, you can use one color to highlight specific bars for your Storytelling.

5. Use value annotations
Annotations can help indicate values where they are important. Annotations are usually placed at the end of the bars. There they are most visible and can be assigned best.

6. Pay attention to order
Delete background shading and grid lines. A grid is distracting and unnecessary when the goal is a larger image. Put the diagram itself in the foreground as an image.

7. Do not forget titles
Bar titles should also be short and descriptive. Refrain from using multiple words and assign a clear keyword. Also, provide a source for your remarks – this will give your data more credibility.

8. Use animations
Animations can help show how data sets interact with each other or how they change over time. Plus, animations are visually appealing and make your bar charts look more exciting. You can find a detailed article about animations in our blog. ►To the blog

Conclusion: Use bar charts for better visualizations of data
For your next presentation in which you want to illustrate data, rely on bar charts instead of column charts. Bar charts offer distinct advantages for visualization. Take our 8 tips to heart to create even better bar charts. Your audience will be amazed!
Are you looking for professionally designed (bar) charts? Feel free to check out our store. Here we have prepared many different types of charts for you to download. For example, this ones here:

You can find many more diagrams in the store ► To the Shop
Do you have questions about bar charts or PowerPoint in general? Do not hesitate to contact us by mail at [email protected]. We will be glad to help you!
These articles might also interest you:
Share this post


-

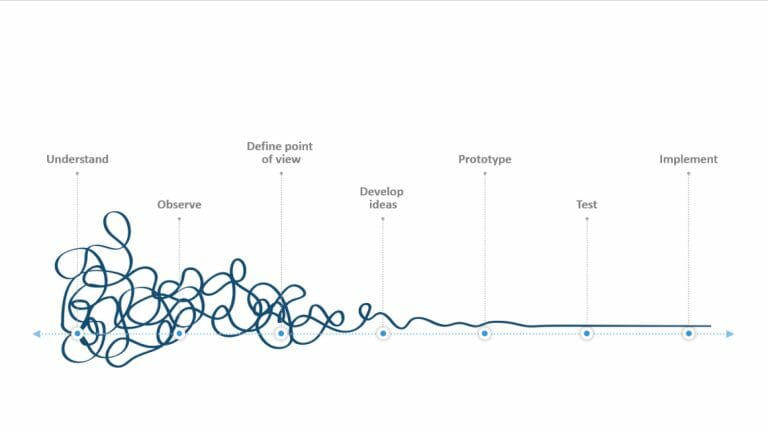
Design Thinking: Problem Solving with a Difference
-
Why Corporate Mission Statements Are So Important
-
7 Tips & Learnings from the Apple Keynote


-
Design Thinking: Problem Solving with a Difference
-
Why Corporate Mission Statements Are So Important
-
7 Tips & Learnings from the Apple Keynote