Creating an Organizational Chart in PowerPoint – Simplifying Complex Structures: Here’s How!
If you want to present complex structures, such as your company’s organizational structure or the organization of a project, using an organizational chart in PowerPoint is a great choice.
Creating an organizational chart is not difficult and it is an effective method to visually represent information ranging from simple to more complex content. In this article, we will show you how to create an organizational chart in PowerPoint and the additional benefits it offers.
What is an Organizational Chart?
The term “organizational chart” is derived from the combination of the words “organization” and “diagram.” This suggests that it is a diagram that represents organized structures in a clear and concise manner.
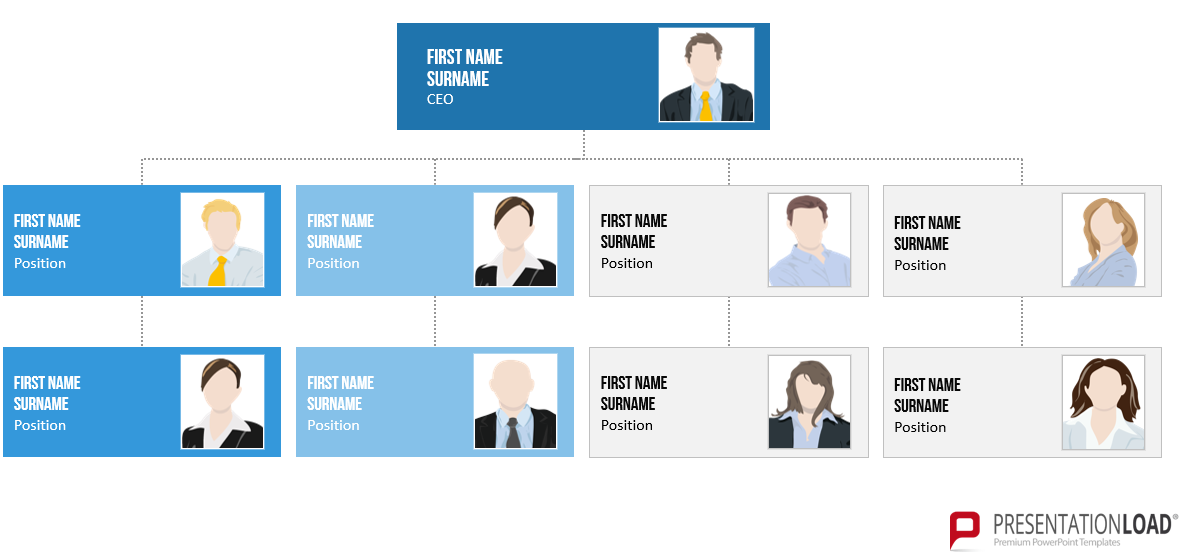
An organizational chart, also known as or org chart, is a graphical layout that represents the internal structure of a company, organization, or project. It can depict various contents and organizational arrangements, such as hierarchies, departments, positions, employees, or contacts, using simple visual box shapes to illustrate the hierarchies and structures effectively.
Instead of boxes, other shapes can also be used. The organizational chart is structured in a way that displays interconnected departments and positions. Such a structure can include photos, names, contact information, symbols, links, and email addresses.
Organizational charts consist of different levels, which can be hierarchical levels or interconnected departments in the case of flat hierarchies. The levels are connected by lines of different styles, such as solid or dashed lines, to indicate the relationships between them.
Other terms used for organizational charts include structure plan or organizational plan. If the diagram also includes job positions, it is referred to as a position plan or staffing plan.
What are the benefits of Organizational Charts?
Organizational charts provide a visualization of the company’s structure and internal hierarchies. An organizational chart can also be created for a department, clearly defining positions and areas of responsibility.
Companies and organizations can have complex structures that may be difficult for outsiders to understand. A well-designed organizational chart ensures that the structures are comprehensible and allows customers or employees to always reach out to the appropriate contact. This is particularly important, for example, in the onboarding process of new employees.
Organizational charts can also be used in various other areas, such as internal personnel or resource planning within the company.
Organizational Charts – these are your advantages!
Organizational charts offer much more than just representing company structures. Here are three additional benefits that organizational charts provide:
#1 Onboarding: Especially as your company continues to grow and change, an organizational chart is useful in providing new employees with an overview of the organization. Organizational charts are also excellent for showcasing the progress of new employees.
#2 Data Security: While it may not be immediately obvious, organizational charts help ensure data security within the company. By clearly displaying functions and positions in the diagram, it becomes evident at a glance who has authorization to access certain documents. This helps prevent files from being sent to someone who should not have access to them.
#3 Customer Benefit: Organizational charts are not only useful for employees but also for customers. Organizational charts allow you to easily demonstrate to your customers who they should contact for questions and concerns. Additionally, it is also interesting for your customers and potentially even job applicants to see how the team is led and structured in your company.
Creating an Organizational Chart – Your Options
Creating an organizational chart can be done using various computer programs. In Windows Office solutions like Microsoft Word or PowerPoint, you can use SmartArt graphics to create an organizational chart.
Other software solutions, such as Visio or Lucidchart, can also be used. Lucidchart is cloud-based and overcomes the limitations of PowerPoint when it comes to creating organizational charts.
To create an organizational chart in PowerPoint, follow our step-by-step guide.
Create an PowerPoint Organizational Chart – Step by Step Tutorial
Creating an organizational chart in PowerPoint is possible even for beginners with a suitable step-by-step guide. The features for creating a diagram in PowerPoint are limited compared to other programs. However, it is still possible to create an organizational chart.
With the use of additional software, such as Lucidchart, the limitations in diagram creation can be overcome.
Before the creation: Types of Organigrams
Before creating an organigram, you should consider what you want to clarify with it and how extensive it should be. You have the option to choose from different types of organigrams:
- Hierarchical organizational chart
The hierarchical organizational chart is the most commonly used form of organigram. The hierarchical structures are clearly depicted. At the top, there is a person with the highest authority and responsibility (e.g., CEO). Moving downwards, there are individuals with less authority and responsibility. This creates a pyramid shape.

- Flat Organizational Chart
This form is also known as a horizontal organizational chart. It typically consists of only two levels and is suitable for visualizing flat hierarchies. For this reason, it is often used by startups.

- Matrix Organizational Chart
This form is well-suited for companies with more than one supervisor. It is particularly suitable for organizations where multiple project managers work and have overlapping responsibilities.

Once you have chosen the type of chart you want to create, you can proceed with creating your organizational chart in PowerPoint.
Step 1: Insert SmartArt Graphic
In MS PowerPoint, start by selecting a new document. Click on “Insert” in the ribbon menu. Here, choose the “SmartArt” option.

In the “SmartArt” selection window, you can now choose the desired graphic type. To create it, select “Hierarchy” as the graphic type and then choose the organizational chart template (layout). Confirm the chosen layout by clicking “OK”.

Step 2: Inserting text into the organizational chart
Add text to the SmartArt graphic by clicking on a shape or field. When creating an organizational chart, it’s important to consider all the structures, positions, or individuals involved. The chart should clarify and not confuse, so it’s essential to think about the appropriate design before creating it.
Each shape or field represents a department, a leader, an employee, or a company position. You can insert job descriptions into the fields as well. Simply click inside the text area, enter your own labels, and format the text as desired. You can show or hide the text pane at any time by clicking the arrow “>” symbol and the control on the edge of the SmartArt graphic in PowerPoint.
Step 3: Adding additional shapes
The selected SmartArt graphic may not have enough fields to create a comprehensive organigram. Therefore, additional shapes need to be added to make the organigram visually appealing. To add fields, click on “Add Shape” under “Create Graphic” in the SmartArt Design tab.

The button allows you to insert a shape into the chart at the desired location. Here, you select who comes before and after the added shape in the hierarchy of the organigram. For example, you can add a subordinate level in the form of a shape to the CEO (Chief Executive Officer).
This shape can represent a department or a subordinate department head reporting to the executive management. Other departments or employees can be assigned under this shape.
Step 4: Adjusting hierarchies
Hierarchies can be adjusted by changing the layout of the organizational chart. If you want to modify the organigram in PowerPoint, select the shape that you want to move by clicking on it.
You can move the selected shape vertically using “Promote” or “Demote”, or horizontally using “Move Down” or “Move Up” to position it correctly. The buttons for moving the shape can be found in the “Create Graphic” section of the SmartArt Design tab.

Step 5: Formatting the Oganizational Chart
The design of the organizational charts can be customized according to your preferences. Once the layout is created as desired, you can begin formatting it. You can try different layout designs, colors, and font styles. The corresponding buttons can be found in the upper area of the screen.
Alternative #1: Lucidchart – Creating Organizational Charts
If you want to create an organizaiontal chart in PowerPoint, you can use the program Lucidchart as an add-in. The program is available for free in its trial version and expands the functionality for creating organizational charts in PowerPoint. You can find more information here.

Lucidchart – What is Needed?
In addition to a modern version of Microsoft PowerPoint, you will need the Lucidchart add-in itself. Additionally, you will need to create a free account with Lucidchart. Once the add-in is installed and you have successfully created an account, you can open a new document in PowerPoint. In the organigram shapes library, select “+ Shapes” to activate additional shapes provided by the add-in.
Lucidchart Shapes Library
If you want to add new shapes, once you have activated the shapes library, you can easily drag and drop the desired shapes into the workspace. After inserting the shape, you can click on the gear icon next to the shape for further editing. Subsequently, the shape itself can be edited in the workspace.
Organizational Chart shapes can also be connected using the add-in. You can create and display any hierarchies in a clear manner. To connect shapes, hover over the shape with your mouse and click on the red dot that appears. Then, you can drag the shape in the desired direction.
Importing Data
Data can be directly imported using the add-in. However, this requires a paid subscription to Lucidchart. If you have a paid account, you just need to provide your data.
The paid version of Lucidchart allows for data import and diagram creation. To successfully import data, the data should be organized in a tabular format and saved in CSV format. Once you have organized the data in this format, you can insert it using the “Import Data” button, which is located below the organigram shapes.
You can include fields such as employee ID, name, department, role in the company, email, phone, supervisor’s ID, and other relevant information.
Alternative #2: Microsoft Visio – create an organizational chart
With Microsoft Visio, you can also quickly create an appealing organizational chart. Visio is a visualization program developed by Microsoft for Windows. You can try a free demo version for 30 days, after which the software becomes paid.
If you have chosen Visio and want to create your organizational chart using the software, simply follow these steps:
- After launching Microsoft Visio, select the “Categories” tab.
- Click on “Business” and choose “Organization Chart” from the options.
- Confirm your selection by clicking the “Create” button.
This will open a new document with a pre-designed organizational chart template that you can customize to fit your specific needs.
Conclusion: Use Organizational Charts to Enhance Visualization of Your Company Structures!
If you want to communicate internal company structures or other hierarchical arrangements, utilizing an organizational chart is highly recommended. With its clear visual representation, complex structures become more understandable.
To create an organizational chart, you can rely on PowerPoint or one of the alternative tools mentioned. With our step-by-step instructions, you can successfully create your own organizational chart.
If you’re in search of professionally designed organizational chart templates, feel free to browse our shop. We offer a variety of templates that may suit your needs, including:


If you have any questions about creating an organizational chart or any general inquiries about PowerPoint, please don’t hesitate to reach out to us at [email protected]. We are here to assist you!
If you’re looking for visually enhanced and professionally designed slide templates, feel free to explore our shop. We have a wide range of slides available for download, covering various (business) topics. Take a look today! ► Visit the Shop
You might also be interested in these articles:
Share this post


-

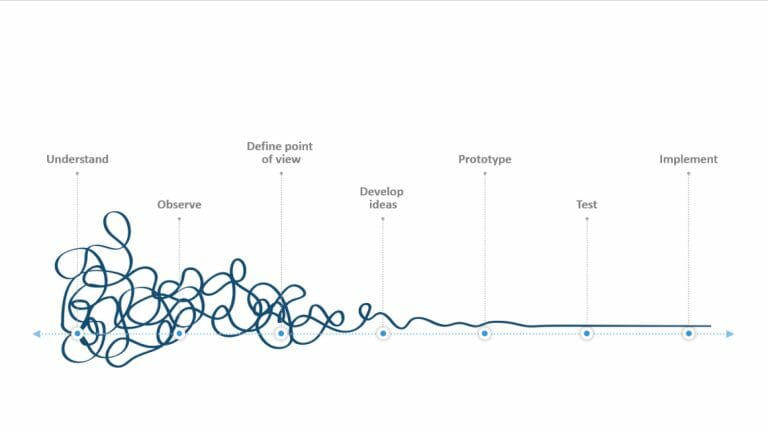
Design Thinking: Problem Solving with a Difference
-
Why Corporate Mission Statements Are So Important
-
7 Tips & Learnings from the Apple Keynote


-
Design Thinking: Problem Solving with a Difference
-
Why Corporate Mission Statements Are So Important
-
7 Tips & Learnings from the Apple Keynote