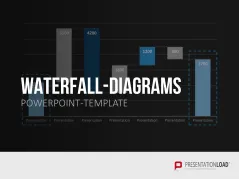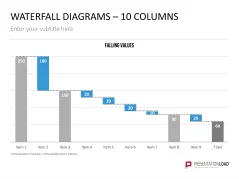
With our data-driven Waterfall Diagrams, present and evaluate the step by step process of change in an initial value.
Factors of Change
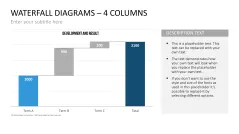
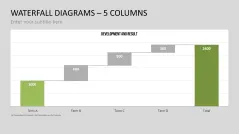
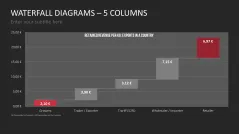
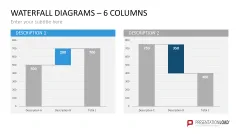
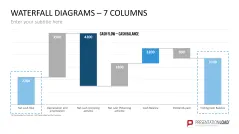
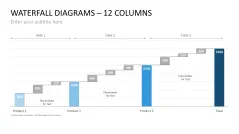
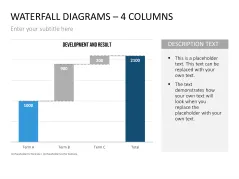
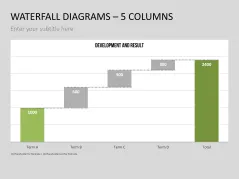
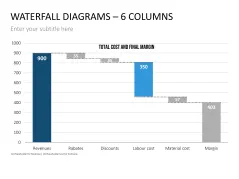
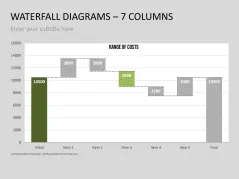
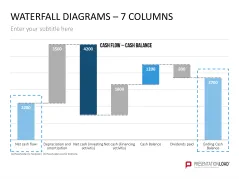
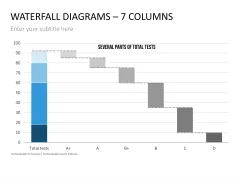
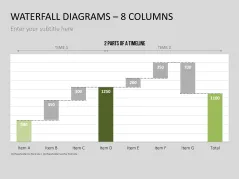
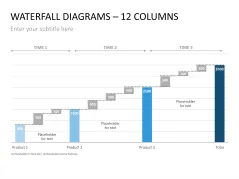
As a special type of column chart, a waterfall diagram is used to clarify the change of an initial value by several factors. The corresponding output value is then entered in a separate column on the left of the diagram.
On the right are the gradual changes. Only the value entered in the respective column is altered. Based on the position of the change column in relation to the output column, the total amount is then indicated (above, the maximum value of the increased output value, below, the deducted). Lastly, this sum will be entered into the last column of the final graph.
Tools of Management Consultancy
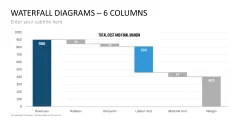
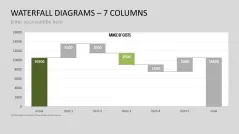
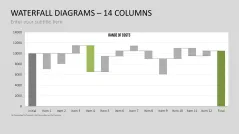
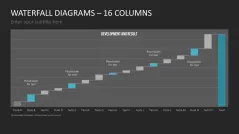
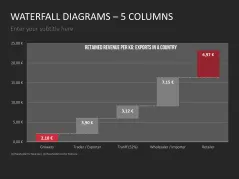
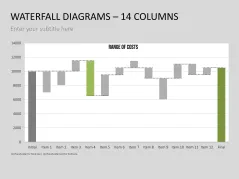
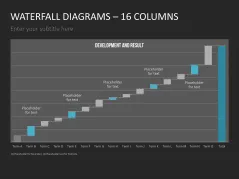
Waterfall Diagrams can be used as a tool to clarify individual costs and their impact on the overall income. Similar to the EBITDA bridge, this type of chart is used to evaluate a company. EBITDA determines the profitability of a company and describes the profit before tax, interest, depreciation, etc. This value is added by using different effects of the waterfall diagram, such as a price increase or the sale of a certain part of the company, resulting in a forecast of future development of corporate earnings.
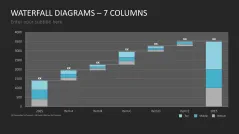
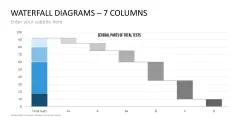
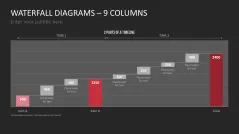
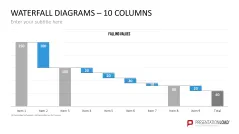
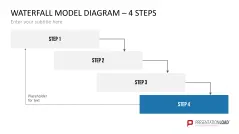
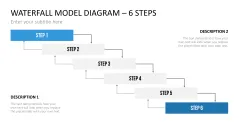
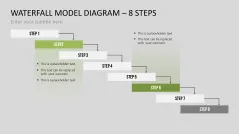
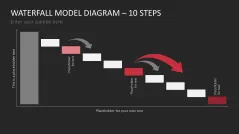
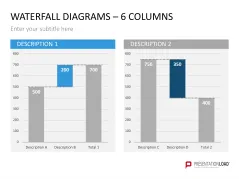
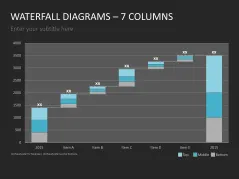
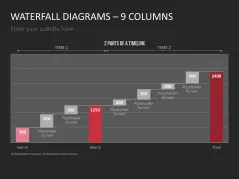
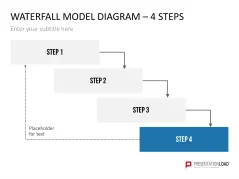
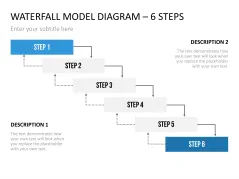
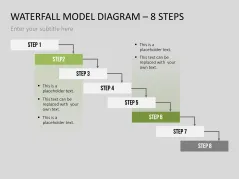
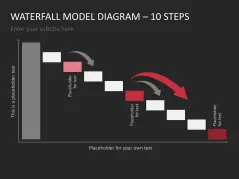
This PowerPoint set includes Waterfall Diagrams of different style and sizes with the largest containing up to 16 individual columns. Each chart is linked to an Excel spreadsheet, on which the each value of the chart can be changed. The chart adjustment on PowerPoint happens automatically. Additionally, this set provides a series of schematic Waterfall Diagrams. Instead of the exact numbers, the focus is on the nesting of individual factors.
Waterfall Diagrams are useful for
- clearly presenting gradual changes of the initial value
- corporate consulting and forecasting future income
- representing the constituents of costs
This PowerPoint Template Includes:
- data-driven Waterfall Diagrams of various types and sizes (up to 16 columns)
- schematic Waterfall Diagrams