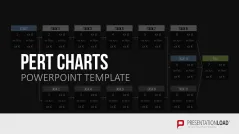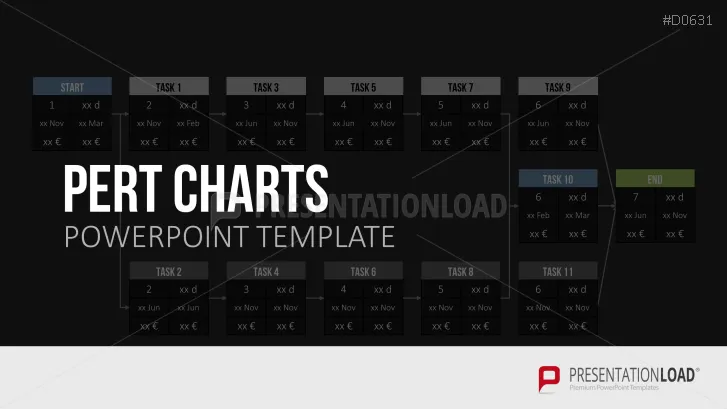
Project management with program evaluation and review technique (PERT): use PERT diagrams for the successful planning and assessment of projects.
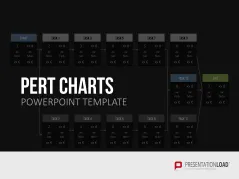
Efficient Project Management with PERT
The PERT method is a crucial part of project management and project planning procedures. When creating effective project approaches, PERT charts serve to present well-structured project schedules and to illustrate every step along the path of accomplishment
Coordinate Workflows
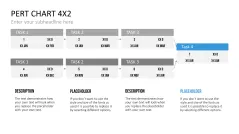
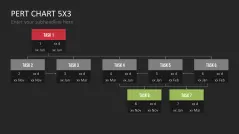
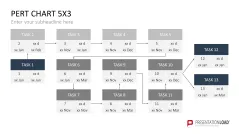
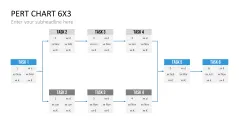
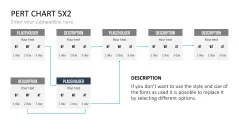
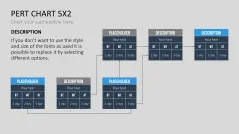
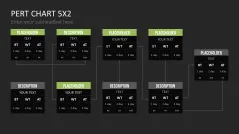
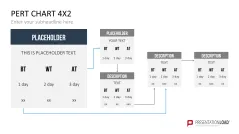
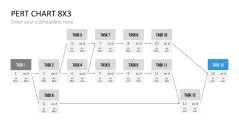
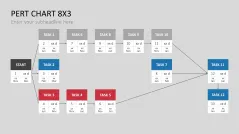
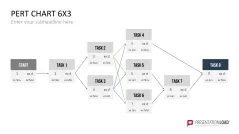
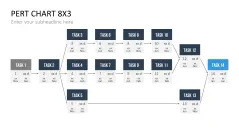
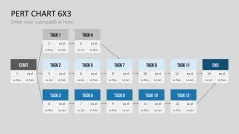
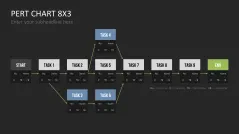
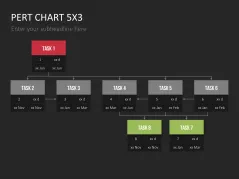
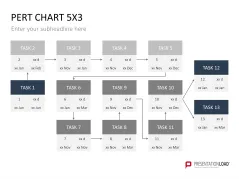
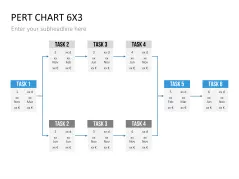
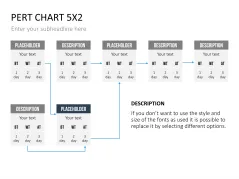
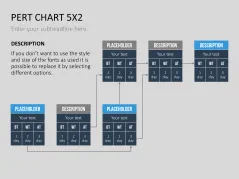
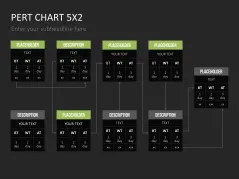
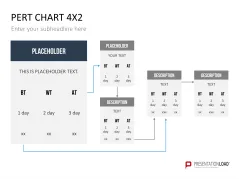
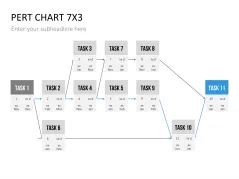
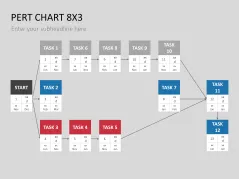
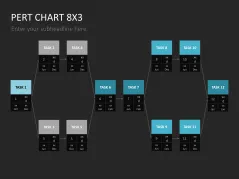
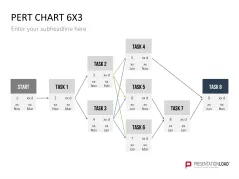
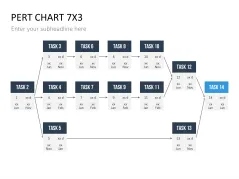
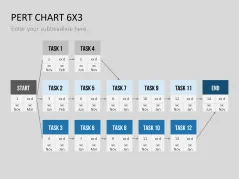
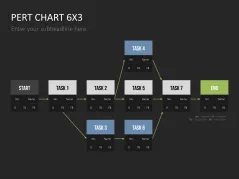
The idea is simple: PERT charts start with an event node which clarifies the respective condition of a project. Arrows show transitions and connections and include definitions of possible time frames and schedules
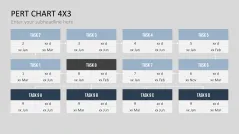
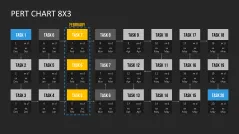
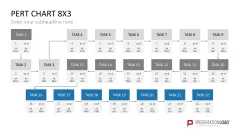
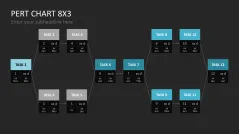
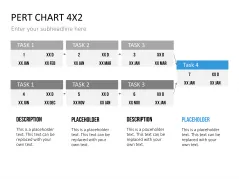
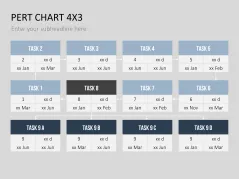
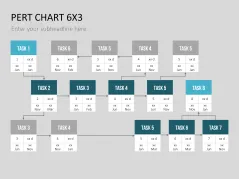
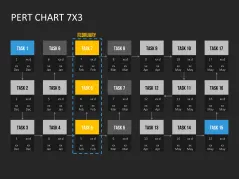
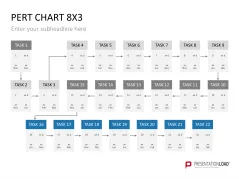
This template set offers a collection of PERT diagrams in various sizes and designs. Use up to 24 different event nodes and fill placeholders with individual content and ideas
These PERT Charts
- professionally support project planning
- offer estimations on possible time schedules
- illustrate parallel procedures
PowerPoint Templates Include:
- collection of PERT charts including up to 24 elements
- event node graphics plus comment boxes