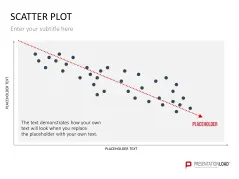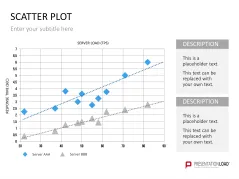
A scatter plot is used to plot the values obtained for two different variables – one along the x axis and the other along the y axis. It is a useful tool for visualizing data and correlations, and for identifying average values, trends, and focal points.
Effective Visual Aids
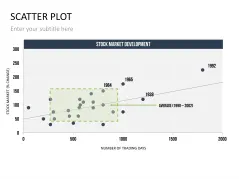
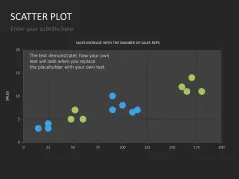
Scatter plots can be particularly helpful in business. If a company records its advertising spend and the number of products sold as data points, for example, the resulting patterns and clusters can give a clear snapshot of how and where the spend was effective.
A Wide Range of Variants
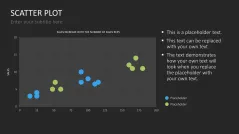
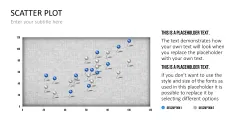
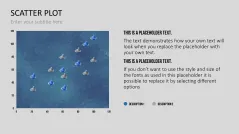
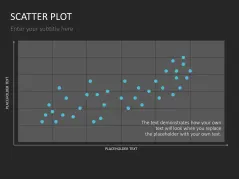
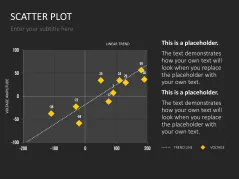
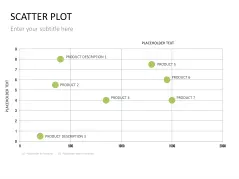
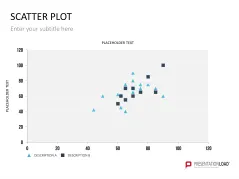
Our template contains a variety of scatter plots in creative designs, such as pin boards and starry skies, in which the data points appear as pins and stars. The diagram panels consist of rectangular meshes, which support the visual highlighting of overlaps.
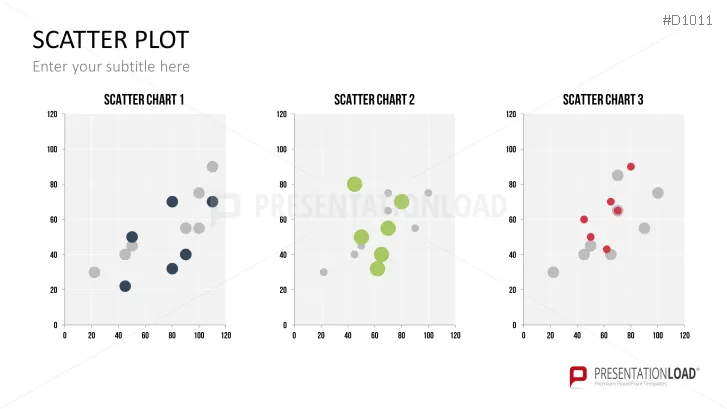
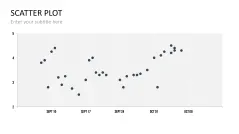
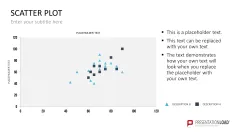
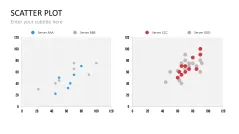
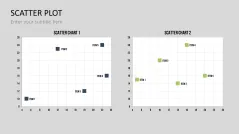
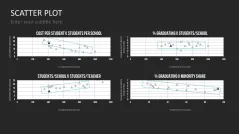
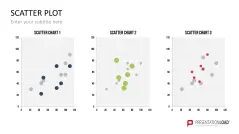
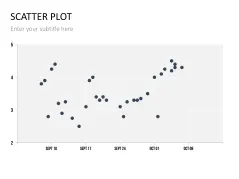
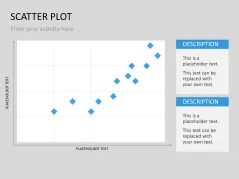
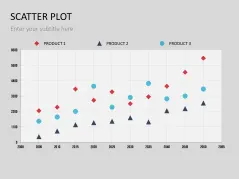
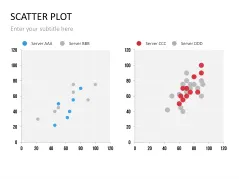
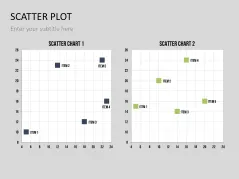
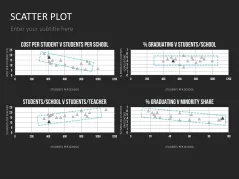
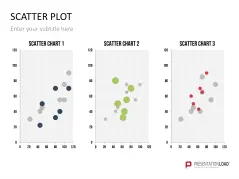
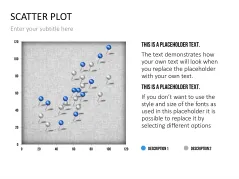
Also included are classic scatter plots containing grids, as well as combination slides allowing you to compare and correlate up to four scatter plots.
With Our Scatter Plots Template You Can
- quickly visualize data points from two variables
- utilize a wide variety of scatter plots in creative designs
- identify correlations of your data with corresponding tools
This PowerPoint Template Contains
- a large selection of data-driven scatter plots
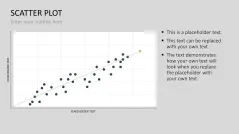
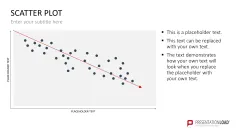
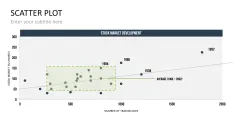
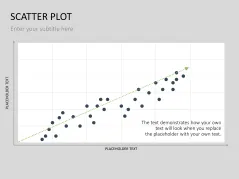
- tools for displaying correlations (regression lines, rectangular field, etc.)
- scatter plots in creative designs (starry sky, pinboard, water)
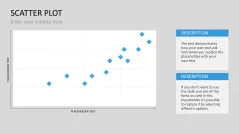
- slides combining scatter plots and text placeholders
- combination slides with two or three scatter plots