The Break-Even Analysis templates allow you to visualize the point where your product or company breaks even with the help of charts in different designs and with pre-placed comments on axes and curve lines.
Determine the Break-Even Point
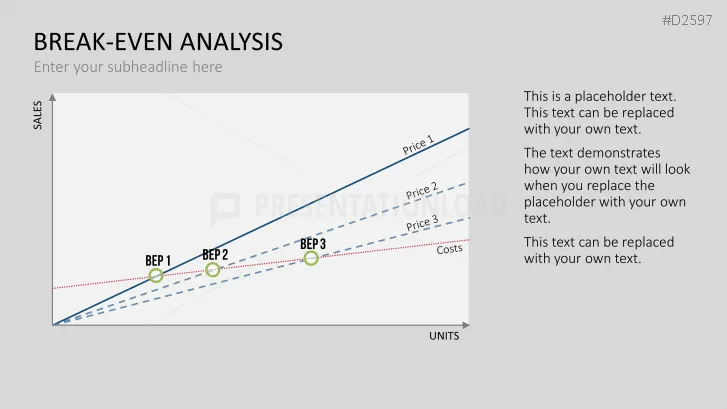
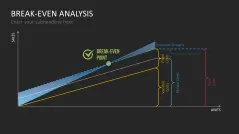
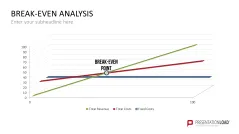
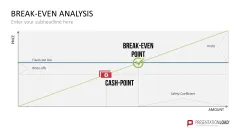
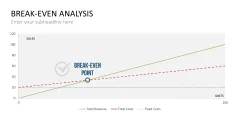
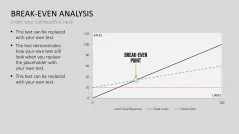
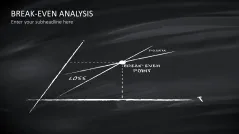
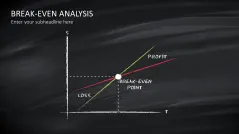
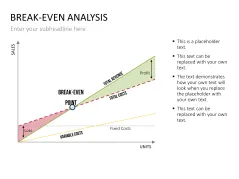
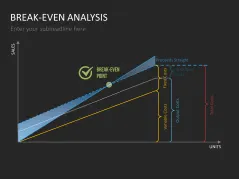
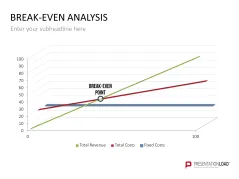
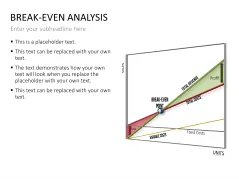
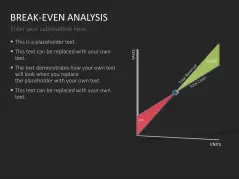
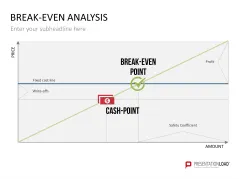
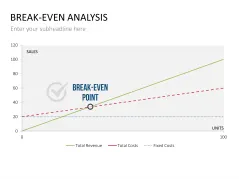
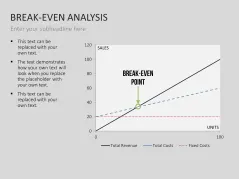
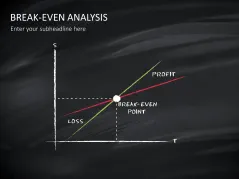
With this analysis (also known as profit/ break-even analysis,) implement business costs and investment calculations to determine the break-even point (BEP) of the total turnover or of the product. At this point, the revenue and the sum of fixed and variable costs are on the same level, existing in full cost coverage. Exceeding this break-even point results in profits falling down to losses.
Conveying BEP to Employees
The BEP is a decision-making and assessment tool for strategic management. For corporate management, it can serve as a benchmark, which should not be exceeded in order to avoid losses, or it can give information about how big sales need to be to cover fixed costs. So that appropriate measures can be taken, it is important to give employees the BEP and its calculation clearly and effectively.
Break-Even Analysis in Numerous Varieties
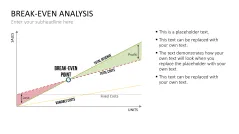
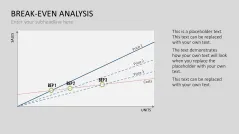
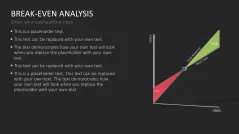
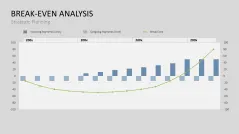
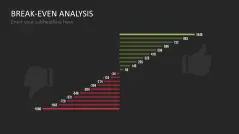
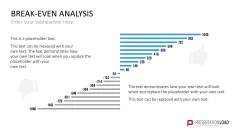
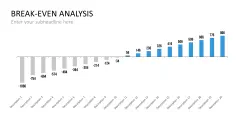
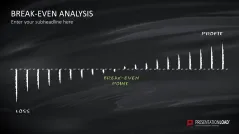
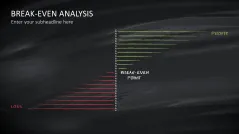
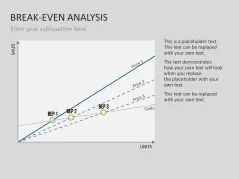
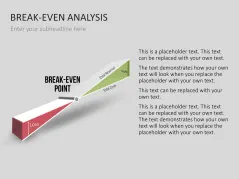
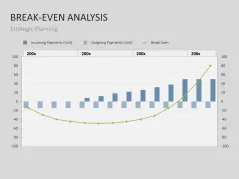
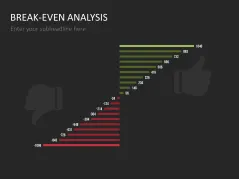
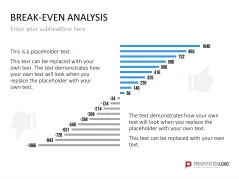
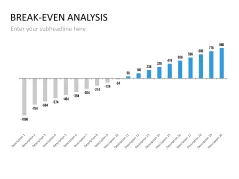
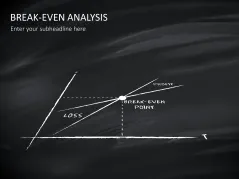
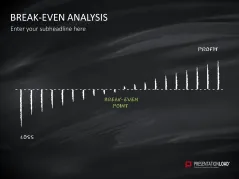
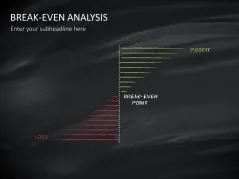
This collection includes Break-Even Analysis templates in various design options, for example, 3D vision and histograms. Pre-placed placeholders allow you to fill in the graphical representation of your BEP with your own values and information. Sketch-like graphics also serve for optical assistance for introducing the subject of the Break-Even Analysis.
With the Break-Even Analysis Templates for PowerPoint, You Can
- quickly determine the break-even point of your product or company
- create your BEP by aesthetic means
- have Break-Even Analysis slides in professional designs
PowerPoint Templates Include
- Break-Even Analysis charts in various designs (3D and 2D optics, bar chart, line chart, etc.)
- pre-placed commentary on lines and axes
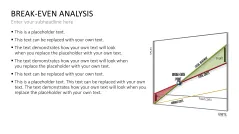
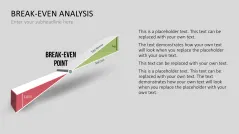
- 4 sketch-like graphics to introduce the subject Break-Even Analysis
- text placeholders to insert your content