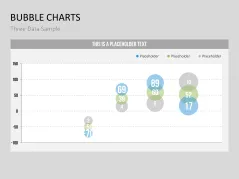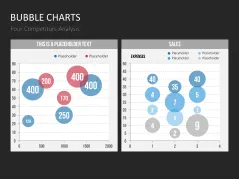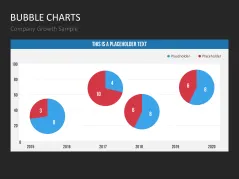
The Bubble Charts for PowerPoint help facilitate the competitive, growth and market share analyses by providing a quick view of different values (up to three) by means of differently sized bubbles in XY-axis charts.
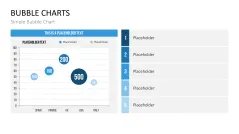
The Bigger the Bubble, the Bigger the Value
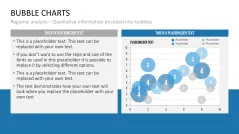
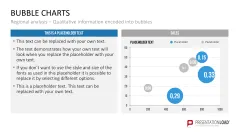
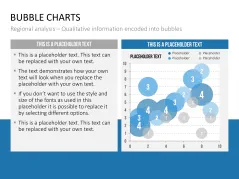
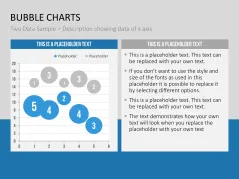
In addition, these charts provide an opportunity for the classical orientation of the X and Y-axis to represent a third value greater than the size of the bubble. The design of bubbles in 3D can also put visual emphasis on the individual values.
A Clear Look at Complex Relationships
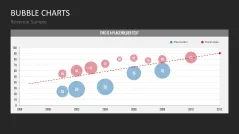
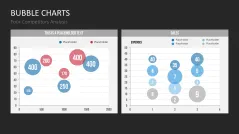
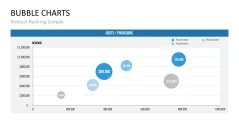
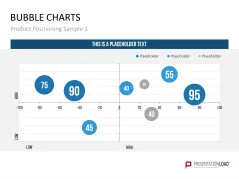
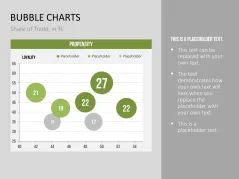
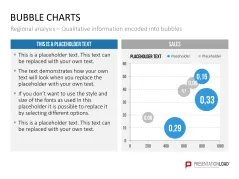
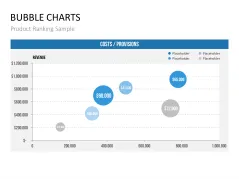
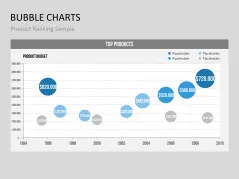
Companies use these charts for displaying relationships between various financial data, e.g., in the context of strategic management in the visualization of the BCG matrix. An example of a bubble chart is to create a market share overview where the level of revenue and product numbers are represented on the X and Y axes, while the market share is shown by the different sizes of the bubbles.
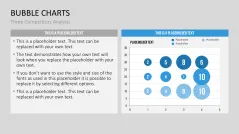
Numerous Bubble Chart Variants
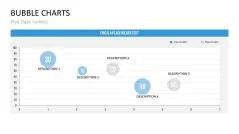
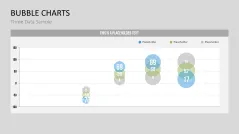
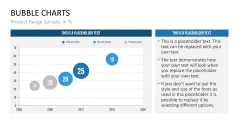
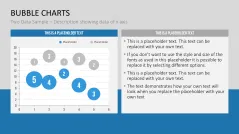
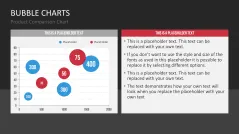
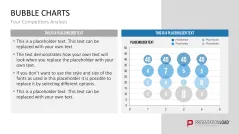
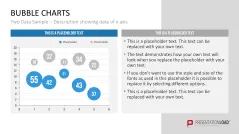
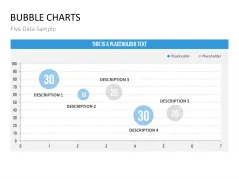
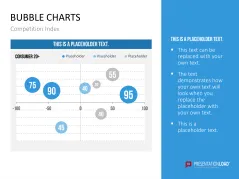
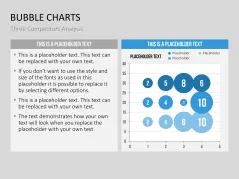
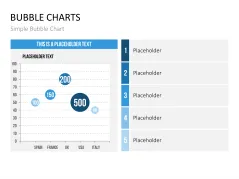
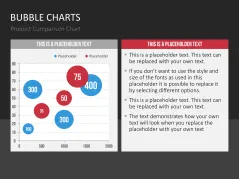
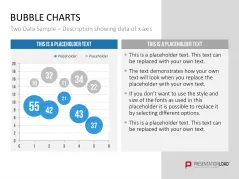
The Bubble Charts contain a wide range of data-driven bubble charts, which adapt the size and position of the bubbles automatically to the input table values. The three-dimensional bubbles spread over shaded XY-axis charts. The chart can be explained by supplementing additional information in the pre-text placeholders.
By Using Bubble Charts, You Can
- receive numerous bubble chart variations in appealing 3D optics
- illustrate complex economic relationships in a graphical manner
- visualize your values by efficiently inputting data in vivid bubble charts
PowerPoint Templates Include
- various bubble charts in 3D
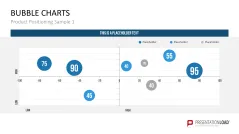
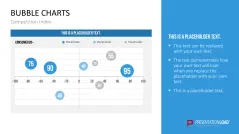
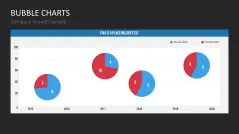
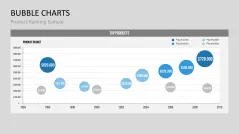
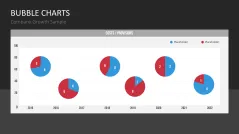
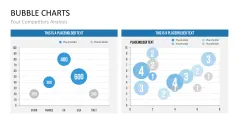
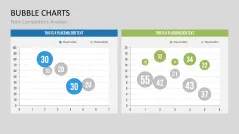
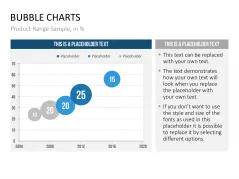
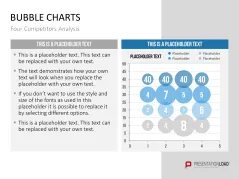
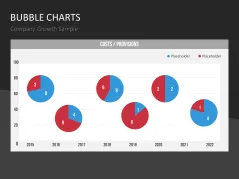
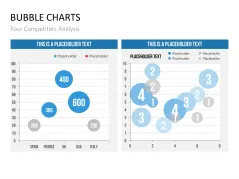
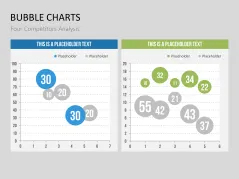
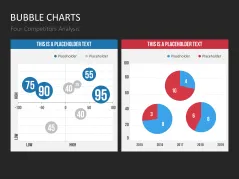
- bubble chart templates on topics such as product ranking, business growth, costs/commissions, competitive analysis, product comparison
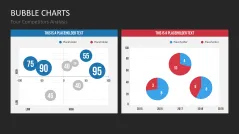
- BCG matrix template
- combined slides with two different bubble charts
- combined slides with bubble chart and text placeholder