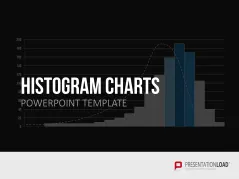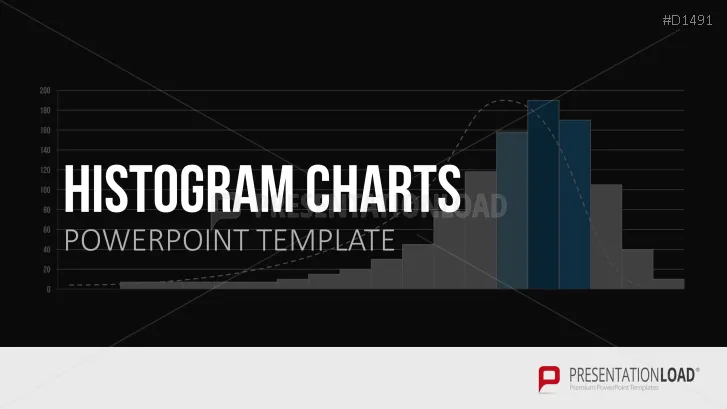
Present Your Continuous Sample Data with Our Customizable Histograms for PowerPoint.
Visualize Frequency Distributions
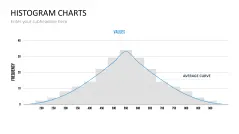
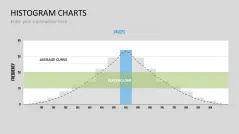
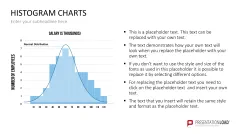
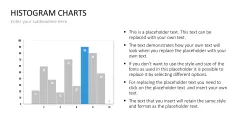
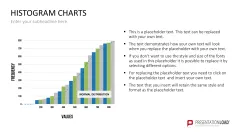
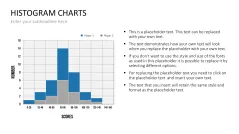
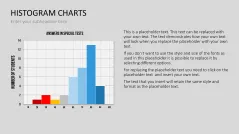
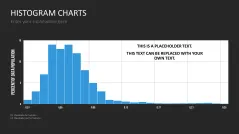
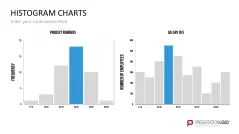
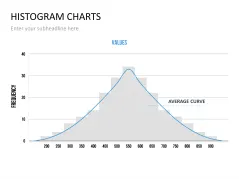
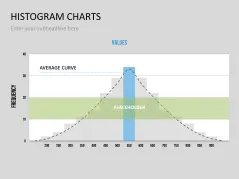
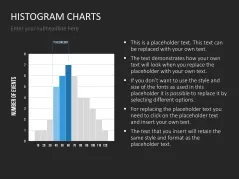
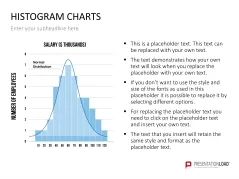
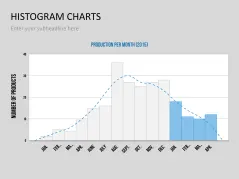
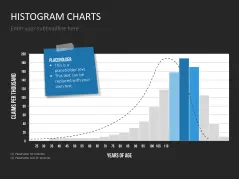
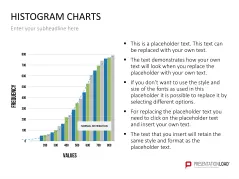
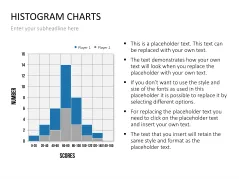
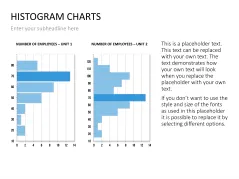
A histogram is a graphical representation that organizes a group of data points into user-specified ranges, which are displayed as rectangular bars with no gaps between them. Taller bars show that more data falls within that range. The column diagrams visualize frequency distributions, providing the basis for data analysis.
Histograms in Presentations
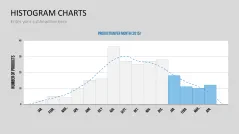
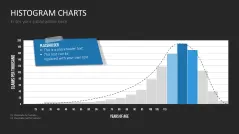
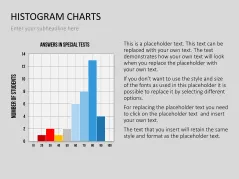
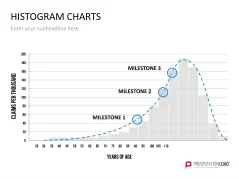
Histograms can be used to display survey results and social data or to analyze sales figures chronologically to spot possible trends. You can also display and analyze process flows and probability distribution.
Widely Customizable
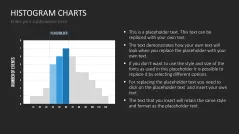
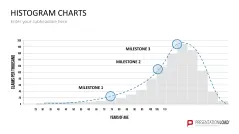
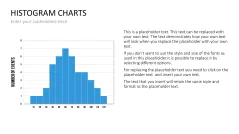
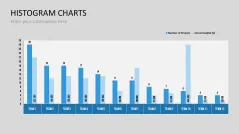
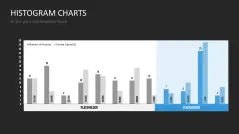
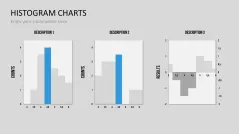
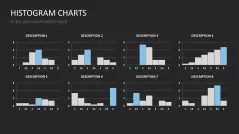
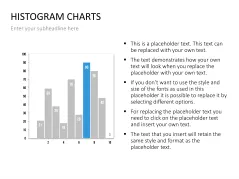
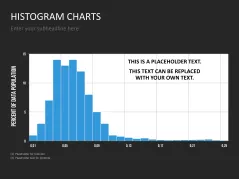
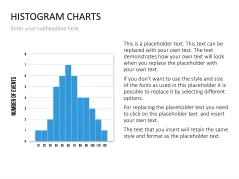
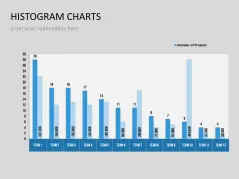
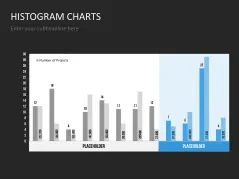
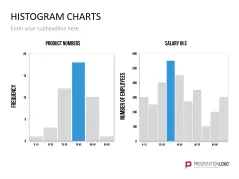
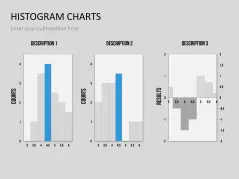
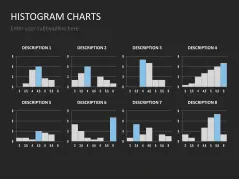
The Histogram Charts set provides you with a broad selection of data-driven histograms in different designs (colored chart columns, a black background, and more) and formats (landscape and portrait). Combined slides with multiple histograms also allow you to compare different data sets. There are combinations of histograms with text placeholders that can be used to add information and explanations.
With Our Histogram Charts Templates You Can
- utilize histograms in numerous designs and formats
- visually illustrate the frequency distributions of your data
- quickly customize ready-made histograms with your own data
This PowerPoint Template Contains
- a large selection of data-driven histograms
- vertical and horizontal layouts
- chart columns in different colors
- comparative histograms
- slides combining histograms and text placeholders